


MsMetrix develops software for processing LC/MS and GC/MS data, applicable to all research and application areas.
We generate reliable conclusions from large and complicated data sets using fast and comprehensive algorithms and methods.
Currently three products are available: MsXelerator™, GC-Analyzer™ and GCxGC-Analyzer™
-
LC/MS
MsXelerator™
Accelerating Data Processing in LC/MS & GC/MS
-
GC/MS
GC-Analyzer™
GC/MS Full Deconvolution & Differential Analysis
-
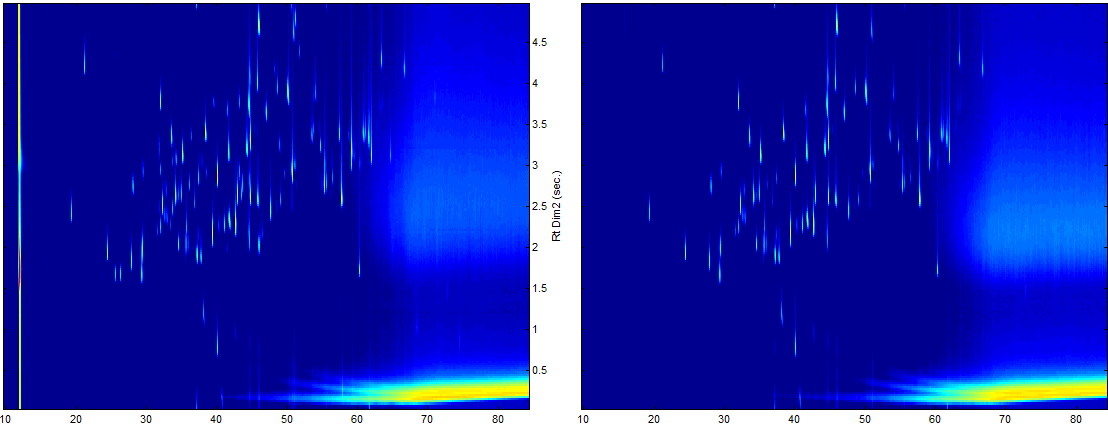
GCxGC/MS
GCxGC-Analyzer™
GGxGC/MS Software Solutions
MsXelerator
MsXelerator contains unique algorithms unparalleled in speed, sensitivity and ease of use. Use one program for all vendors for Accurate Detection, Differential Analysis, Isotope Peak Finding, Identification and Metabolomics Data Analysis for LC/MS & GC/MS