High Resolution Differential Analysis: Find Unique Peaks in your Sample not Present in the Control
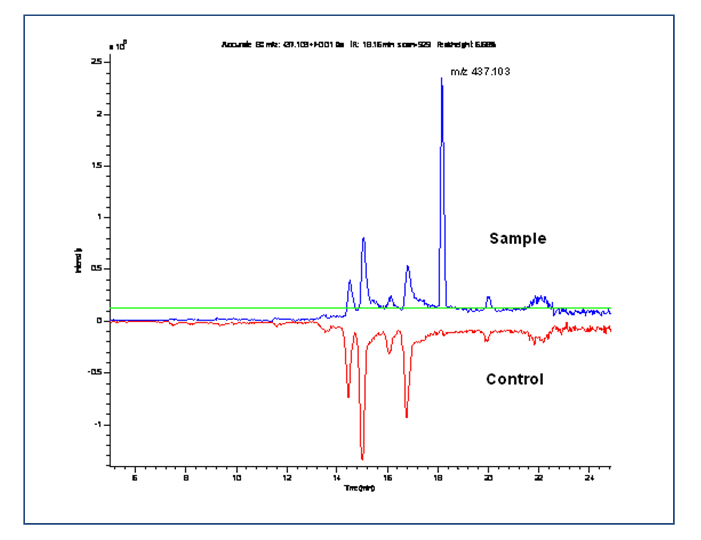
To quickly find all unique Chromatographic Peaks in your sample not present in the control, use Differential Analysis. A full analysis only takes a few seconds and will compare thousands of peaks. Time shifts in the control and sample are detected and corrected automatically. Plot the exact mass chromatograms of sample and control in overlay and mirror mode. Peaks from the control can be deleted from the results directly.
Differential Analysis has the following features:
- Runs for any number of peaks at any resolution
- Shifted samples can be aligned using Correlation Optimized Warping automatically
- Calculates all Ratios (Area and Height) between Sample and Control Peaks
- Can be applied to more than one control sample simultaneously
- Can also be applied in combination with other filtering tools
- In general takes no more than 10 seconds to complete a full differential analysis
- Combination of tools: e.g. Differential Analysis + Neutral Loss Filtering
- After Differential Analysis you can make use of all the Identification Tools