
Drug Metabolite Profiling: Species Comparison
The MS Compare module of MsXelerator offers a large number of tools and views to process series of samples and can be used for the simultaneous analysis of series of samples. Included is:
- View series of samples: Mass Chromatograms and Mass Spectra
- Load MS and UV data from 10-20 samples and click on a any UV peak to identify the Mass
- Align UV with MS data for better comparison.
- Define groups of samples and detect unique differences
- Statistical Analysis of group differences
- Click and Identify: TIC/EIC, BPC/EIC or UV/EIC.
- Pre-process your data including four different alignment methods
- Principal Component Analysis and Clustering. Get a good overview of your data.
Data in the example are from a Metabolite Profiling study: 12 samples from 6 species, both male and female were analyzed. Samples were analyzed on two time points (t=0 and t=3 hours).
MS Compare was used to perform the following tasks:
- Align all chromatograms using a peak matching algorithm
- Identify, quantify and tabulate all major metabolite peaks
- Perform univariate and multivariate comparison between species (PCA)
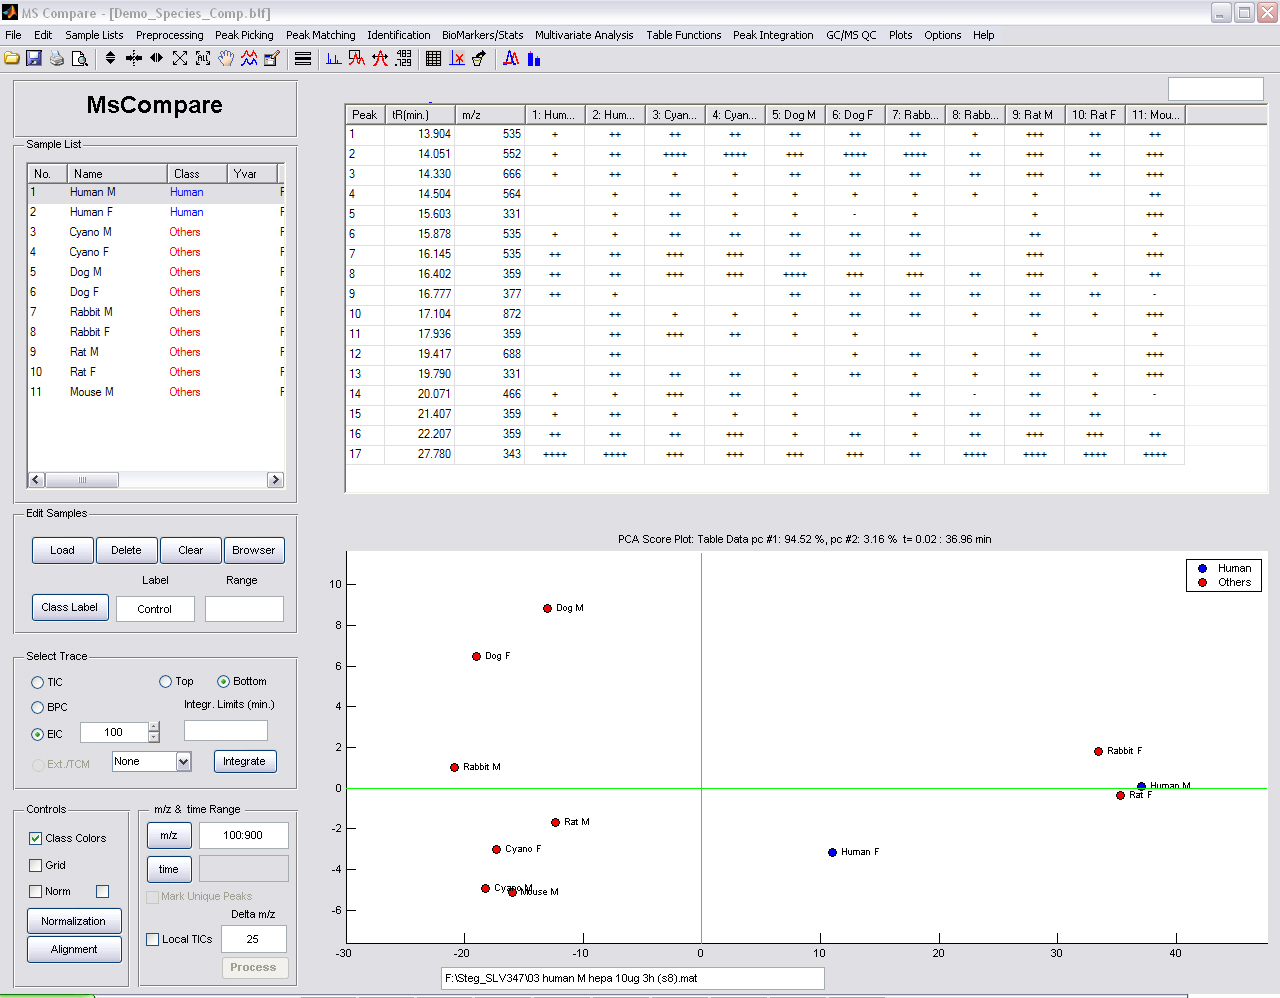
From the PCA plot, species which are most similar to Human can be identified. The comparison is based on all metabolites simultaneously and not only the parent.