GC/MS Metabolomics
Metabolic profiling of humans, animals and plants is increasingly important for understanding disease and monitoring the effects of drug treatment, nutritional regimes and toxicity.
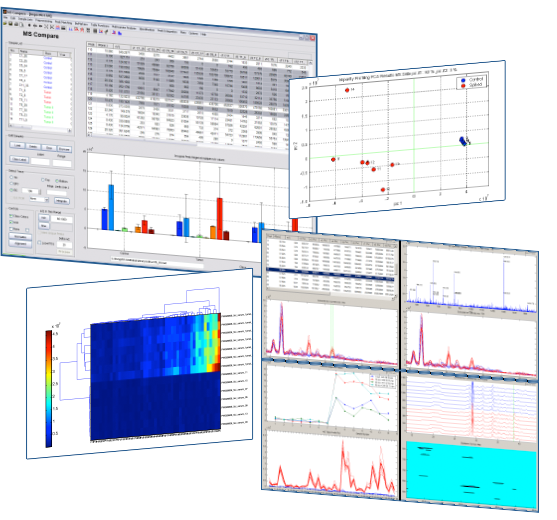
In many research fields, Gas Chromatography – Mass Spectrometry (GC/MS) plays an important role. The MsCompare® software offers a large collection of tools, algorithms and visualization techniques for what in general could be called: Comparative Analysis. MsCompare offers all of the operations needed for processing GC/MS datasets and finding statistically significant differences between groups of samples:
MsCompare Features
Supported Vendor Formats
- Currently supported LC/MS and GC/MS data formats: Thermo Xcalibur, Waters Masslynx, Bruker, Agilent, AB Sciex, mzXML, mzData and NetCDF.
Data Pre-Preprocessing Tools
- If needed, data can be pre-processed in different ways: Smoothing of extracted Ion Currents, Baseline Correction
- Normalization: MsCompare offers visualization tools to decide whether normalization of your data is necessary: Normalization types that can be selected are: Area TIC, Range Scaling, Unit Vector Scaling, Normalization based on selected Reference Peak(s) or import of user defined normalization constants from external methods.
- Creating of Groups and Classes: easily define your experiments and create multiple groups. All visualization tools in MsCompare offer coloring of individual samples based on group assignment.
Alignment
Alignment of chromatograms is necessary if case that shifts between peaks in different samples are moderate or severe. Depending on the complexity of the samples, alignment can be very difficult and often results in non-optimal results. MsCompare offers 4 different alignment algorithms that can be used individually or sequentially.
- COW: Correlation Optimized Warping
- Reference Peak Warping: in many cases the chromatograms (TIC) contain too many peaks to get good results using COW. In these cases use manual or automatic Reference Peak Warping. When used in “Auto Mode” the algorithm will find proper reference peak present in all samples. Alignment is subsequently applied to the selected reference peaks.
Comparative Analysis
- Peak Picking: Run Peak Picking on all samples individually. Cluster peaks into groups and create final result table to be used for further statistical or multivariate analysis
- Deconvolution of individual fragments into components
- Identification using direct link with NIST GC/MSDatabases
Statistical and Multivariate Analysis
Once you have created a result table, you can apply univariate or Multivariate methods to find significant and relevant peaks that are different between samples from different groups.
Univariate Tools:
- P-and t- statistics, Ratio Group Statistics, Uniqueness Values (find peak completely absent in one of the groups), Fisher Z-statistics, Intensity weighted ratios. View all statistics in one table for all groups.
Multivariate Tools:
- Principal Component Analysis (PCA) on the result table, TIC, Mass Spectra etc. Produces interactive Scores and Loading plots. Selected samples or variables are visualized in different plots (overlay of EIC, Concentration Profiles etc.)
- Partial Least Squares (PLS) and PLS-DA using interactive visualization tools.
- Storing and loading of PCA and PLS models.
- Extended Canonical Variates Analysis (ECVA)
- Support Vector Machines (SVM).
- Hierarchical Clustering of samples and variables.
- Correlation Maps.
Visualization